Chart Recognition
Although charts within documents contain useful information, they are normally parsed as images, making it difficult to utilize them for tasks such as search, QA, or RAG. Extracting numerical data from charts into tables allows seamless integration into existing text-based pipelines, enabling the effective utilization of chart information. While one could use a multi-modal LLM to address this issue, it tends to be more expensive and leads to a more complex pipeline compared to text-based LLMs.
With the chart recognition feature in Upstage Document Parse, the following chart types are recognized and converted into a table format.
- Bar charts
- Line charts
- Pie charts
The following is an example.
Chart input
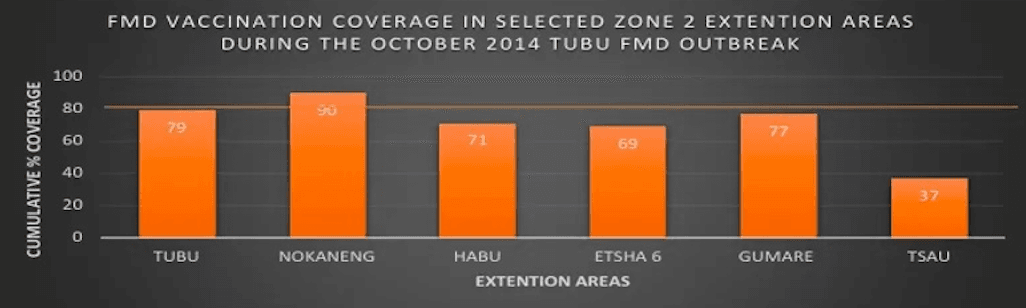
HTML output
<img>: Coordination information for the chart<figcaption>: Chart metadata, with each item separated by a<p>tag- Chart title (Optional): The title of the chart
- X-axis (Optional): The x-axis label
- Y-axis (Optional): The y-axis label
- Chart type: Identified as bar, line, or pie chart
<table>: The recognized chart data in table format
Under the hood, confidence scores for chart recognition are calculated for each chart.
If chart recognition is successful according to the confidence score,
the chart is categorized as a chart and the resulting table is displayed in HTML.
If recognition fails, the chart is categorized as a figure and the response contains HTML, Markdown and text.
If chart recognition succeeds → "Chart"
html:<figcaption>and<table>elements are added inside the<figure data-category='chart'>tagmarkdown: The result in Markdown formattext: The result in raw text
If chart recognition fails → "Figure"
html: The OCR result is added to the alt attribute of the<img>tag within<figure data-category='chart'>markdown: The OCR resulttext: The OCR result